+ Reply to Thread
Page 13 of 24 FirstFirst 1 3 13 23 24 LastLast
Results 241 to 260 of 469

Thread: The Arctic is melting, the Antarctic is freezing. What does this mean?

  1. Link to Post #241
    France On Sabbatical
    Join Date
    7th March 2011
    Location
    Brittany
    Posts
    16,763
    Thanks
    60,315
    Thanked 95,902 times in 15,481 posts

    Default Re: The Arctic is melting, the Antarctic is freezing. What does this mean?

    Mid-ocean ridge eruptions as a climate valve
    Maya Tolstoy

    Abstract:
    Seafloor eruption rates, and mantle melting fueling eruptions, may be influenced by sea-level and crustal loading cycles at scales from fortnightly to 100 kyr. Recent mid-ocean ridge eruptions occur primarily during neap tides and the first 6 months of the year, suggesting sensitivity to minor changes in tidal forcing and orbital eccentricity. An ~100kyr periodicity in fast-spreading seafloor bathymetry, and relatively low present-day eruption rates, at a time of high sea-level and decreasing orbital eccentricity suggest a longer term sensitivity to sea-level and orbital variations associated with Milankovitch cycles. Seafloor spreading is considered a small but steady contributor of CO2 to climate cycles on the 100 kyr time scale, however this assumes a consistent short-term eruption rate. Pulsing of seafloor volcanic activity may feed back into climate cycles, possibly contributing to glacial/inter-glacial cycles, the abrupt end of ice ages, and dominance of the 100 kyr cycle.

    ###
    The research for this paper was funded in large part by the U.S. National Science Foundation.

    Copies of the paper, “Mid-ocean ridge eruptions as a climate valve” are available from the author, or the Earth Institute press office. (I have a request in for a copy and will post excerpts when it is supplied -Anthony Update: The author kindly provided a pre-print copy, linked below, plus a selected figure, note the uptick in the present)

    The paper: Tolstoy_inpress_GRL_2015 (PDF)

    Tolstoy figure 3A:


    =====================================================
    The above is the main source paper for this article:
    =====================================================

    Inconvenient study: Seafloor volcano pulses may alter climate – models may be wrong

    Anthony Watts / 20 hours ago

    February 5, 2015
    New data show strikingly regular patterns, from weeks to eons
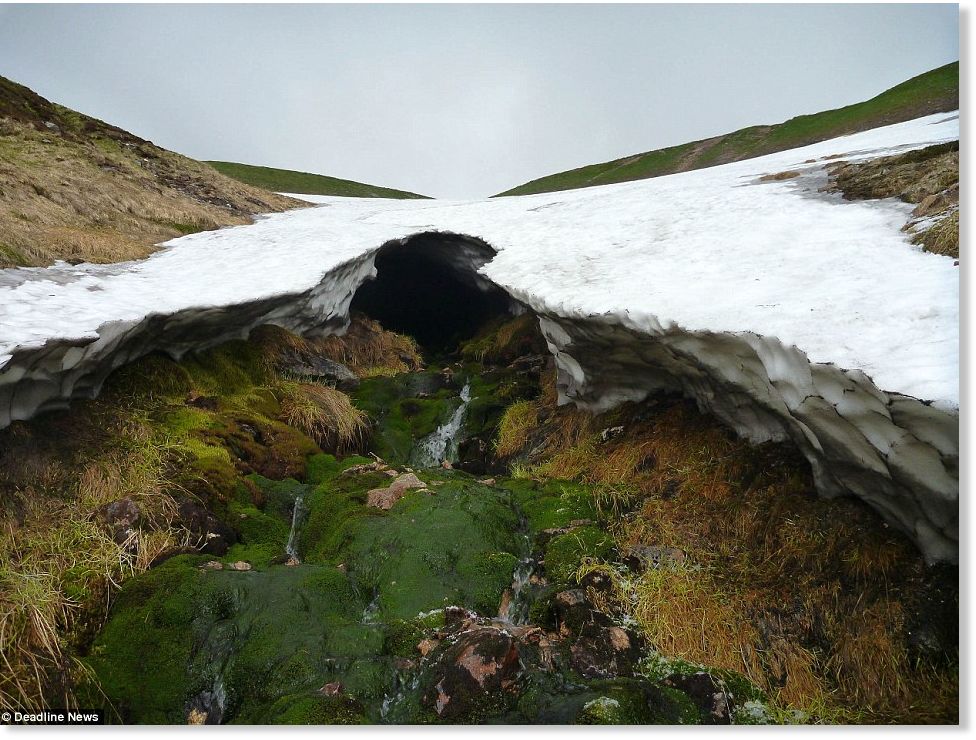
    This topographic map of Earth’s ocean floor in the Atlantic ocean reveals thousands of sub-oceanic volcanoes along the mid-Atlantic ridge. Source: http://www.sciencemag.org/content/346/6205/32.summary

    From The Earth Institute at Columbia University:
    Vast ranges of volcanoes hidden under the oceans are presumed by scientists to be the gentle giants of the planet, oozing lava at slow, steady rates along mid-ocean ridges. But a new study shows that they flare up on strikingly regular cycles, ranging from two weeks to 100,000 years–and, that they erupt almost exclusively during the first six months of each year. The pulses–apparently tied to short- and long-term changes in earth’s orbit, and to sea levels–may help trigger natural climate swings.

    Scientists have already speculated that volcanic cycles on land emitting large amounts of carbon dioxide might influence climate; but up to now there was no evidence from submarine volcanoes. The findings suggest that models of earth’s natural climate dynamics, and by extension human-influenced climate change, may have to be adjusted. The study appears this week in the journal Geophysical Research Letters.

    “People have ignored seafloor volcanoes on the idea that their influence is small–but that’s because they are assumed to be in a steady state, which they’re not,” said the study’s author, marine geophysicist Maya Tolstoy of Columbia University’s Lamont-Doherty Earth Observatory. “They respond to both very large forces, and to very small ones, and that tells us that we need to look at them much more closely.” A related study by a separate team this week in the journal Science bolsters Tolstoy’s case by showing similar long-term patterns of submarine volcanism in an Antarctic region Tolstoy did not study.

    Volcanically active mid-ocean ridges crisscross earth’s seafloors like stitching on a baseball, stretching some 37,000 miles. They are the growing edges of giant tectonic plates; as lavas push out, they form new areas of seafloor, which comprise some 80 percent of the planet’s crust. Conventional wisdom holds that they erupt at a fairly constant rate–but Tolstoy finds that the ridges are actually now in a languid phase. Even at that, they produce maybe eight times more lava annually than land volcanoes. Due to the chemistry of their magmas, the carbon dioxide they are thought to emit is currently about the same as, or perhaps a little less than, from land volcanoes–about 88 million metric tons a year. But were the undersea chains to stir even a little bit more, their CO2 output would shoot up, says Tolstoy.

    Some scientists think volcanoes may act in concert with Milankovitch cycles–repeating changes in the shape of earth’s solar orbit, and the tilt and direction of its axis–to produce suddenly seesawing hot and cold periods. The major one is a 100,000-year cycle in which the planet’s orbit around the sun changes from more or less an annual circle into an ellipse that annually brings it closer or farther from the sun. Recent ice ages seem to build up through most of the cycle; but then things suddenly warm back up near the orbit’s peak eccentricity. The causes are not clear.

    Enter volcanoes. Researchers have suggested that as icecaps build on land, pressure on underlying volcanoes also builds, and eruptions are suppressed. But when warming somehow starts and the ice begins melting, pressure lets up, and eruptions surge. They belch CO2 that produces more warming, which melts more ice, which creates a self-feeding effect that tips the planet suddenly into a warm period. A 2009 paper from Harvard University says that land volcanoes worldwide indeed surged six to eight times over background levels during the most recent deglaciation, 12,000 to 7,000 years ago. The corollary would be that undersea volcanoes do the opposite: as earth cools, sea levels may drop 100 meters, because so much water gets locked into ice. This relieves pressure on submarine volcanoes, and they erupt more. At some point, could the increased CO2 from undersea eruptions start the warming that melts the ice covering volcanoes on land?

    That has been a mystery, partly because undersea eruptions are almost impossible to observe. However, Tolstoy and other researchers recently have been able to closely monitor 10 submarine eruption sites using sensitive new seismic instruments. They have also produced new high-resolution maps showing outlines of past lava flows. Tolstoy analyzed some 25 years of seismic data from ridges in the Pacific, Atlantic and Arctic oceans, plus maps showing past activity in the south Pacific.

    The long-term eruption data, spread over more than 700,000 years, showed that during the coldest times, when sea levels are low, undersea volcanism surges, producing visible bands of hills. When things warm up and sea levels rise to levels similar to the present, lava erupts more slowly, creating bands of lower topography. Tolstoy attributes this not only to the varying sea level, but to closely related changes in earth’s orbit. When the orbit is more elliptical, Earth gets squeezed and unsqueezed by the sun’s gravitational pull at a rapidly varying rate as it spins daily–a process that she thinks tends to massage undersea magma upward, and help open the tectonic cracks that let it out. When the orbit is fairly (though not completely) circular, as it is now, the squeezing/unsqueezing effect is minimized, and there are fewer eruptions.

    The idea that remote gravitational forces influence volcanism is mirrored by the short-term data, says Tolstoy. She says the seismic data suggest that today, undersea volcanoes pulse to life mainly during periods that come every two weeks. That is the schedule upon which combined gravity from the moon and sun cause ocean tides to reach their lowest points, thus subtly relieving pressure on volcanoes below. Seismic signals interpreted as eruptions followed fortnightly low tides at eight out of nine study sites. Furthermore, Tolstoy found that all known modern eruptions occur from January through June. January is the month when Earth is closest to the sun, July when it is farthest–a period similar to the squeezing/unsqueezing effect Tolstoy sees in longer-term cycles. “If you look at the present-day eruptions, volcanoes respond even to much smaller forces than the ones that might drive climate,” she said.

    Daniel Fornari, a senior scientist at Woods Hole Oceanographic Institution not involved in the research, called the study “a very important contribution.” He said it was unclear whether the contemporary seismic measurements signal actual lava flows or just seafloor rumbles and cracking. But, he said, the study “clearly could have important implications for better quantifying and characterizing our assessment of climate variations over decadal to tens to hundreds of thousands of years cycles.”

    Edward Baker, a senior ocean scientist at the National Oceanic and Atmospheric Administration, said, “The most interesting takeaway from this paper is that it provides further evidence that the solid Earth, and the air and water all operate as a single system.”

  2. The Following 10 Users Say Thank You to Hervé For This Post:

    animovado (15th September 2015), Bill Ryan (23rd February 2015), christian (15th February 2015), Daughter of Time (20th April 2015), fourty-two (10th February 2015), Jean-Marie (6th February 2015), meat suit (6th February 2015), Reinhard (10th February 2015), Sierra (1st June 2015), TargeT (23rd February 2015)

  3. Link to Post #242
    France On Sabbatical
    Join Date
    7th March 2011
    Location
    Brittany
    Posts
    16,763
    Thanks
    60,315
    Thanked 95,902 times in 15,481 posts

    Default Re: The Arctic is melting, the Antarctic is freezing. What does this mean?

    Arctic seafloor afire with lava-spewing volcanoes

    By Robert On February 9, 2015 · 6 Comments

    The scale and magnitude of the explosive activity dwarfs anything seen on other mid-ocean ridges.

    Judging by the amount of gas and molten lava blasting out of underwater volcanoes near the North Pole, the Arctic seafloor is geologically explosive. Literally.

    “Explosive volatile discharge has clearly been a widespread, and ongoing, process,” according to an international team that sent unmanned probes to the scalding waters far beneath the Arctic ice.

    Red-hot magma blows off the tops of dozens of submarine volcanoes
    The team found that red-hot magma has been rising from deep inside the earth and blown the tops off dozens of submarine volcanoes, four km (2.4 miles) below the ice. “Jets or fountains of material were probably blasted one, maybe even two, km (.6 to 1.2 miles) up into the water,” says geophysicist Robert Sohn of the Woods Hole Oceanographic Institution, who led the expedition.

    Imagine the explosive power it took to overcome water pressure that far down. According one estimate, the water pressure where the Titanic came to rest – about 2.5 miles below the surface – is more than 6,500 pounds per square inch. Imagine the force that could propel volcanic debris more than a mile upward through that kind of pressure.


    The team sent three unmanned probes down through the ice to explore a small stretch of the Gakkel Ridge where a swarm of undersea earthquakes had occurred in 1999.

    The probes, one of which was able to manuever just two to five meters (7 to 16 feet) above the ocean floor, discovered evidence of remarkable under-sea eruptions. They found dozens of distinctive flat-topped volcanoes whose eruptions had scattered a layer of dark, smoky volcanic glass across the seabed.

    Dwarfs anything we’ve seen on other mid-ocean ridges
    “The scale and magnitude of the explosive activity that we’re seeing here dwarfs anything we’ve seen on other mid-ocean ridges,” says Sohn, who studies ridges around the world. The volume of gas and lava that appears to have blasted out of the Gakkel volcanoes is “much, much higher” than that seen at other ridges.

    Huge volumes of CO2 gas


    Black smoker

    The scientists say the heat released by the explosions is not contributing to the melting of the Arctic ice, but Sohn says the huge volumes of CO2 gas that belched out of the undersea volcanoes likely contributed to rising concentrations of greenhouse gases in the atmosphere. How much, he couldn’t say.

    “I had the impression this whole central volcano area was oozing warm fluid,” says Henrietta Edmonds of the University of Texas, who was on the expedition tracking the plumes of warm waters rising from the spreading ridge. The plumes point to the presence of “gushing black smokers” as well as microbial and other forms of life that can thrive in scalding, mineral-rich waters that percolates out of spreading ridges, opines Edmonds.

    “Not contributing to the melting of the Arctic ice”?
    How in the world can they say that underwater volcanoes are “not contributing to the melting of the Arctic ice”?

    Measuring some 1,800 km (1,100 miles) long, the Gakkel Ridge is made up of mile after mile after mile of huge underwater volcanoes. This chain of underwater volcanoes is far mightier than the Alps, which measure “only” 1,200 km (750 mi.) long. The entire chain of submarine volcanoes certainly dwarfs the miniscule 30 km- (18-mile-) long area that these scientists explored.

    How many of these huge volcanoes are active? No one seems to know (or at least we’re not being told about it).

    What is clear, however, is that this is not an isolated incident. I posted an article about the Gakkel Ridge back in 2006 entitled “Underwater volcanic activity in the Arctic Ocean far stronger than anyone imagined.”

    In that article, I described the findings of the Arctic Mid-Ocean Ridge Expedition (AMORE), which included scientists from the Max Planck Institute for Chemistry and other international institutions.

    Magmatism “dramatically” higher than expected
    The scientists had expected that the Gakkel ridge would exhibit “anemic” magmatism. Instead, they found “surprisingly strong magmatic activity in the West and the East of the ridge and one of the strongest hydrothermal activities ever seen at mid-ocean ridges.” Indeed, magmatism was “dramatically” higher than expected.

    Hydrothermal hot springs on the seafloor were also far more abundant than predicted.

    “We expected this to be a hydrothermally dead ridge, and almost every time our water measurement instrument came up, they showed evidence of hydrothermal activity, and once we even ‘saw’ an active hot spring on the sea floor,” said Dr. Jonathan Snow, the leader of the research group from the Max Planck Institute.
    So let me ask you something. These volcanoes are pumping out 2,100-degree-hot basalt and scalding hot water, and yet we are to believe that they are “not contributing to the melting of the Arctic ice”?

    C’mon. Let’s get real.

    Could answer one question that scientists have pondered for years.
    In fact, these underwater volcanoes could answer one question that scientists have been asking for years.

    During the last ice age, even though much of Canada was buried beneath one to two miles of ice, studies have shown that ice cover on the Arctic Ocean remained essentially the same as today. No one has been able to explain why. I think underwater volcanic activity on the Gakkel Ridge can provide that missing explanation.

    See entire article, “Study finds Arctic seabed afire with lava-spewing volcanos”:

    http://www.canada.com/topics/news/wo...e-f48c0dc90304

    Thanks to E Hughes for this link
    Quote * This article was published on Canada.com and in the journal Nature, on June 26, 2008. Unfortunately, I did not become aware of it until now. It is apparently of no interest to the mainstream media.
    Comments:
    Quote captainfish says: February 9, 2015 at 8:39 pm

    “The scientists say the heat released by the explosions is not contributing to the melting of the Arctic ice, but Sohn says the huge volumes of CO2 gas that belched out of the undersea volcanoes likely contributed to rising concentrations of greenhouse gases”…..

    Ummmmm.. so massive dumps of heat and magma have no impact whatsoever on the region, but the exuded CO2 does?

    BWWAAHAAHAHHHAHAHAAAAA
    "La réalité est un rêve que l'on fait atterrir" San Antonio AKA F. Dard

    Troll-hood motto: Never, ever, however, whatsoever, to anyone, a point concede.

  4. The Following 11 Users Say Thank You to Hervé For This Post:

    animovado (15th September 2015), Bill Ryan (23rd February 2015), christian (15th February 2015), Daughter of Time (20th April 2015), fourty-two (10th February 2015), Jake (10th February 2015), Reinhard (15th September 2015), Selkie (15th September 2015), Sierra (1st June 2015), Sunny-side-up (10th February 2015), TargeT (23rd February 2015)

  5. Link to Post #243
    France On Sabbatical
    Join Date
    7th March 2011
    Location
    Brittany
    Posts
    16,763
    Thanks
    60,315
    Thanked 95,902 times in 15,481 posts

    Default Re: The Arctic is melting, the Antarctic is freezing. What does this mean?

    For the record:

    "La réalité est un rêve que l'on fait atterrir" San Antonio AKA F. Dard

    Troll-hood motto: Never, ever, however, whatsoever, to anyone, a point concede.

  6. The Following 11 Users Say Thank You to Hervé For This Post:

    animovado (15th September 2015), Baby Steps (15th September 2015), Bill Ryan (23rd February 2015), BMJ (5th April 2015), Daughter of Time (20th April 2015), JRS (23rd February 2015), Reinhard (15th September 2015), Selkie (15th September 2015), Sierra (1st June 2015), TargeT (23rd February 2015), Wind (24th February 2015)

  7. Link to Post #244
    France On Sabbatical
    Join Date
    7th March 2011
    Location
    Brittany
    Posts
    16,763
    Thanks
    60,315
    Thanked 95,902 times in 15,481 posts

    Default Re: The Arctic is melting, the Antarctic is freezing. What does this mean?

    New official Canadian government map shows sea ice gains in Arctic

    By Robert On April 20, 2015 ·
    The updated map, unveiled this week by Natural Resources Canada, shows what appears to be more Arctic sea ice than its 2006 predecessor, despite warnings about global warming accelerating the loss of sea ice.


    Arctic Sea Ice Map – 2014-


    Arctic Sea Ice Map – 2006

    Why the difference? The 2014 map adopts a new way of representing sea ice, explained Yvan Désy, director of the Canada Centre for Remote Sensing.

    The revised methodology follows international standards, with data for the map supplied by Environment Canada’s Canadian Ice Service.

    More sea ice due to 30-year median analysis
    The 2014 map is based on a median level of ice for the month of September over 30 years, when sea ice typically reaches its seasonal low. The period analyzed was between 1981-2010.

    By comparison, the previous map only accounted for the permanent polar ice, said Denis Dubé, a senior forecaster with the Canadian Ice Service.

    Previous representation of only the polar ice was “more fictitious”
    In a way, the previous representation of only the polar ice was “more fictitious,” said Dubé, because that level of ice coverage — effectively a “minimum of minimums” — would not be seen year to year.

    Some critics denounced the new official map as employing a bit of cartographic “fakery.”

    See larger interactive map
    http://www.cbc.ca/news/multimedia/ar...2014-1.3037627

    http://www.cbc.ca/news/technology/ar...nada-1.3036224

    Thanks to Garnet Lynne for these links
    "La réalité est un rêve que l'on fait atterrir" San Antonio AKA F. Dard

    Troll-hood motto: Never, ever, however, whatsoever, to anyone, a point concede.

  8. The Following 5 Users Say Thank You to Hervé For This Post:

    Bill Ryan (20th April 2015), Daughter of Time (20th April 2015), justntime2learn (24th July 2015), Reinhard (15th September 2015), Wind (20th April 2015)

  9. Link to Post #245
    France On Sabbatical
    Join Date
    7th March 2011
    Location
    Brittany
    Posts
    16,763
    Thanks
    60,315
    Thanked 95,902 times in 15,481 posts

    Default Re: The Arctic is melting, the Antarctic is freezing. What does this mean?

    Global Warming is dead: NASA satellites show polar ice caps growing instead of receding

    James Taylor, Forbes, Tue, 19 May 2015 15:25 UTC


    NASA satellite measurements show the polar ice caps have not retreated at all.

    Updated data from NASA satellite instruments reveal the Earth's polar ice caps have not receded at all since the satellite instruments began measuring the ice caps in 1979. Since the end of 2012, moreover, total polar ice extent has largely remained above the post-1979 average. The updated data contradict one of the most frequently asserted global warming claims - that global warming is causing the polar ice caps to recede.

    The timing of the 1979 NASA satellite instrument launch could not have been better for global warming alarmists. The late 1970s marked the end of a 30-year cooling trend. As a result, the polar ice caps were quite likely more extensive than they had been since at least the 1920s. Nevertheless, this abnormally extensive 1979 polar ice extent would appear to be the "normal" baseline when comparing post-1979 polar ice extent.

    Updated NASA satellite data show the polar ice caps remained at approximately their 1979 extent until the middle of the last decade. Beginning in 2005, however, polar ice modestly receded for several years. By 2012, polar sea ice had receded by approximately 10 percent from 1979 measurements. (Total polar ice area - factoring in both sea and land ice - had receded by much less than 10 percent, but alarmists focused on the sea ice loss as "proof" of a global warming crisis.)

    NASA satellite measurements show the polar ice caps have not retreated at all.

    A 10-percent decline in polar sea ice is not very remarkable, especially considering the 1979 baseline was abnormally high anyway. Regardless, global warming activists and a compliant news media frequently and vociferously claimed the modest polar ice cap retreat was a sign of impending catastrophe. Al Gore even predicted the Arctic ice cap could completely disappear by 2014.

    In late 2012, however, polar ice dramatically rebounded and quickly surpassed the post-1979 average. Ever since, the polar ice caps have been at a greater average extent than the post-1979 mean.

    Now, in May 2015, the updated NASA data show polar sea ice is approximately 5 percent above the post-1979 average.

    During the modest decline in 2005 through 2012, the media presented a daily barrage of melting ice cap stories. Since the ice caps rebounded - and then some - how have the media reported the issue?

    The frequency of polar ice cap stories may have abated, but the tone and content has not changed at all. Here are some of the titles of news items I pulled yesterday from the front two pages of a GoogleNews search for "polar ice caps":

    "Climate change is melting more than just the polar ice caps"

    "2020: Antarctic ice shelf could collapse"

    "An Arctic ice cap's shockingly rapid slide into the sea"

    "New satellite maps show polar ice caps melting at 'unprecedented rate'"

    The only Google News items even hinting that the polar ice caps may not have melted so much (indeed not at all) came from overtly conservative websites. The "mainstream" media is alternating between maintaining radio silence on the extended run of above-average polar ice and falsely asserting the polar ice caps are receding at an alarming rate.

    To be sure, receding polar ice caps are an expected result of the modest global warming we can expect in the years ahead. In and of themselves, receding polar ice caps have little if any negative impact on human health and welfare, and likely a positive benefit by opening up previously ice-entombed land to human, animal, and plant life. Nevertheless, polar ice cap extent will likely be a measuring stick for how much the planet is or is not warming.

    The Earth has warmed modestly since the Little Ice Age ended a little over 100 years ago, and the Earth will likely continue to warm modestly as a result of natural and human factors. As a result, at some point in time, NASA satellite instruments should begin to report a modest retreat of polar ice caps. The modest retreat - like that which happened briefly from 2005 through 2012 - would not be proof or evidence of a global warming crisis. Such a retreat would merely illustrate that global temperatures are continuing their gradual recovery from the Little Ice Age. Such a recovery - despite alarmist claims to the contrary - would not be uniformly or even on balance detrimental to human health and welfare. Instead, an avalanche of scientific evidence indicates recently warming temperatures have significantly improved human health and welfare, just as warming temperatures have always done.
    "La réalité est un rêve que l'on fait atterrir" San Antonio AKA F. Dard

    Troll-hood motto: Never, ever, however, whatsoever, to anyone, a point concede.

  10. The Following 7 Users Say Thank You to Hervé For This Post:

    animovado (15th September 2015), Daughter of Time (24th July 2015), fourty-two (24th July 2015), meat suit (2nd June 2015), seko (1st June 2015), TargeT (15th September 2015), Wind (3rd June 2015)

  11. Link to Post #246
    Finland Avalon Member Wind's Avatar
    Join Date
    25th September 2011
    Location
    A dream called Life
    Age
    33
    Posts
    7,888
    Thanks
    88,326
    Thanked 48,968 times in 7,673 posts

    Default Re: The Arctic is melting, the Antarctic is freezing. What does this mean?

    "When you've seen beyond yourself, then you may find, peace of mind is waiting there." ~ George Harrison

  12. The Following 5 Users Say Thank You to Wind For This Post:

    Daughter of Time (24th July 2015), fourty-two (24th July 2015), Hervé (3rd June 2015), justntime2learn (24th July 2015), Reinhard (15th September 2015)

  13. Link to Post #247
    Finland Avalon Member Wind's Avatar
    Join Date
    25th September 2011
    Location
    A dream called Life
    Age
    33
    Posts
    7,888
    Thanks
    88,326
    Thanked 48,968 times in 7,673 posts

    Default Re: The Arctic is melting, the Antarctic is freezing. What does this mean?

    The data isn't lying, the real one I mean (which we can also witness with our own eyes and ears).

    "When you've seen beyond yourself, then you may find, peace of mind is waiting there." ~ George Harrison

  14. The Following 6 Users Say Thank You to Wind For This Post:

    Daughter of Time (24th July 2015), fourty-two (24th July 2015), Hervé (24th July 2015), justntime2learn (24th July 2015), Reinhard (15th September 2015), TargeT (15th September 2015)

  15. Link to Post #248
    France On Sabbatical
    Join Date
    7th March 2011
    Location
    Brittany
    Posts
    16,763
    Thanks
    60,315
    Thanked 95,902 times in 15,481 posts

    Default Re: The Arctic is melting, the Antarctic is freezing. What does this mean?

    Arctic global warming research expedition put on hold – Too much ice

    by Robert July 22, 2015


    22 July 2015 – A carefully planned, 115-day scientific expedition on the Canadian icebreaker CCGS Amundsen has been put on hold as the vessel was called to help resupply ships navigate heavy ice on the eastern side of Hudson Bay.

    “Obviously it has a large impact on us,” says Martin Fortier, executive director of ArcticNet, which coordinates research on the vessel. “It’s a frustrating situation.”

    During the summer, ArcticNet utilizes the Amundsen as a floating research center, running experiments 24 hours a day.

    Worst ice conditions in 20 years
    Johnny Leclair, assistant commissioner for the Coast Guard, said Tuesday conditions in the area are the worst he’s seen in 20 years.

    With only two icebreakers available in the Arctic — the CCGS Pierre Radisson has been escorting resupply ships through ice-choked Frobisher Bay — he said the only option was to re-deploy the Amundsen

    http://www.cbc.ca/news/canada/north/...162900?cmp=rss

    Thanks to Jim S and Laurel for this link

    Notes: In the above photo, the CCGS Pierre Radisson escorts an oil tanker through the ice to Iqaluit on July 17, where heavy ice has delayed this summer’s annual resupply. Photo courtesy Canadian Dept. of Fisheries & Oceans (DFO)

    According to their website, “the objective of ArcticNet is to study the impacts of climate change and modernization in the coastal Canadian Arctic.”


    Related:
    Arctic sea ice much more resilient than previously thought
    "La réalité est un rêve que l'on fait atterrir" San Antonio AKA F. Dard

    Troll-hood motto: Never, ever, however, whatsoever, to anyone, a point concede.

  16. The Following 7 Users Say Thank You to Hervé For This Post:

    animovado (15th September 2015), Bill Ryan (15th September 2015), Daughter of Time (24th July 2015), fourty-two (24th July 2015), justntime2learn (24th July 2015), Selkie (18th August 2015), Wind (24th July 2015)

  17. Link to Post #249
    France On Sabbatical
    Join Date
    7th March 2011
    Location
    Brittany
    Posts
    16,763
    Thanks
    60,315
    Thanked 95,902 times in 15,481 posts

    Default Re: The Arctic is melting, the Antarctic is freezing. What does this mean?

    It has been cooling for 7,000 years – Must-see video

    August 17, 2015 Robert

    “We are in the midst of a perfectly, perfectly natural cycle,” says David Dilley, former NOAA meteorologist.


    Seven thousand years ago there was 50 percent less ice in the Arctic than there is today, says Dilley. It has been cooling ever since, and it’s about to get worse.

    The recent cold winters and expanding polar ice caps are ominous signs of a global cooling that has already begun, says Dilley. Instead of warming, we need to worry about the coming 125-year cool period, which has already begun.

    I ran this video a few days ago. If you haven’t seen it you must, MUST watch it. It will scare the pants off you.

    In this must-see 49-minute video presentation – “Is Climate Change Dangerous?“- Mr. Dilley, CEO and senior research scientist at Global Weather Oscillations, Inc., explains why we need to focus on the real problem of a coming cooling.

    During a glacial period you will have ice all the way down to Cape Cod, Massachusetts, says Dilley. During the last ice age, Central New England had ice a mile thick year round.

    Dilley, who has forty-two years of professional experience in meteorology and climatology, was with NOAA for twenty of those years.

    The government is wrong with its claims of a coming warming, says Dilley, who accuses the federal government of fiddling with global temperature data thereby producing a false picture of what is going on.

    Here are the points he makes in the video:

    1. The 18+ years temperature pause is real. (4.09)
    2. Natural cycles are behind the current pause.
    3. Ice cores show CO2 lags temperature. (5.00)
    4. 7000 years ago there was 50% less Arctic ice. (8.20)
    5. The 1000-year cycle is real. (9.20)
    6. Planet has been cooling over past 10,000 years. (9.34)
    7. Natural cycles are driving our climate. (10.04)
    8. Shows cooling from 2023 to 2150.
    9. Current warming is perfectly natural.
    10. Milankovitch cycles driving large-scale cycles. (13.00)
    11. Gravitational forces can bulge Earth’s core by 1.4 km (15.35)
    12. Gravitational forces impact global temperature (17.20)
    13. Warming and cooling both begin at the poles (17.48)
    14. Arctic warming/melt was caused by warm ocean pulses (19.50)
    15. “Now starting to see a dramatic cooling in the Arctic“. (22.50)
    16. “Arctic is cooling rapidly now. Rapidly!” (24.06)
    17. Both poles are cooling rapidly now. (25.05(
    18. Poles don’t show signs of warming. (26.30)
    19. Western drought and Eastern cold due to 26-year cycle. (27.55)
    20. Polar vortices due to Arctic/global cooling. (29.25)
    21. Lunar cycles correlated with warming/cooling cycles. (31.30)
    22. Rapid global cooling by 2019. (32.00)
    23. “Temperature fiddling…more political than anything”. (32.56)
    24. “Could be the biggest scientific scandal ever”. (33.20)
    25. IPCC using “estimated temperatures”. (34.00)
    26. How the government manipulated, rewrote data. (36.00)
    27. “This is temperature fiddling.” Not the truth. (36.45)
    28. NASA, NOAA’s “politically driven press releases”. (37.00)
    29. Met Office calls NOAA’s 2014 claim untrue. (38.00)
    30. Major data fiddling, cheating by NOAA. (39.50)
    31. “The 97% consensus is bogus”. (41.00)
    32. John Cook cooked the consensus data. (41.30)
    33. 85% meteorologists say climate change is natural. (42.20)
    34. Global cooling is the real danger. (43.20)
    35. Volcanoes and cooling often correlated. (44.00)
    36. Crop failures from cooling “very likely”. (45.45)
    37. “Extremely cold” from 2025 to 2050. (46.36)
    38. Global cooling next 125 years. (47.00)
    39. “The cooling is coming”.

    http://iceagenow.info/2015/08/extrem...ologist-video/

    Thanks to Andrew Stranglen, Ronald Baker and Salvatore Del Prete for this info


    David Dilley, Global Weather Oscillations

    Visit David’s website at:
    www.GlobalWeatherCycles.com

    See also Mr. Dilley’s Free Ebook “Natural Climate Pulse” here:
    http://www.globalweatheroscillations.com/#!ebook-
    natural-climate-pulse/cnuz
    "La réalité est un rêve que l'on fait atterrir" San Antonio AKA F. Dard

    Troll-hood motto: Never, ever, however, whatsoever, to anyone, a point concede.

  18. The Following 10 Users Say Thank You to Hervé For This Post:

    araucaria (18th August 2015), Baby Steps (15th September 2015), Bill Ryan (15th September 2015), Daughter of Time (18th August 2015), Elainie (18th August 2015), Jean-Marie (18th August 2015), onawah (27th August 2015), Reinhard (18th August 2015), Selkie (18th August 2015), Wind (19th August 2015)

  19. Link to Post #250
    United States Avalon Member onawah's Avatar
    Join Date
    28th March 2010
    Language
    English
    Posts
    22,272
    Thanks
    47,766
    Thanked 116,620 times in 20,704 posts

    Default Re: The Arctic is melting, the Antarctic is freezing. What does this mean?

    Global Warming that Never was this Summer
    Posted by Dr Sircus on August 27, 2015
    http://drsircus.com/world-news/globa...eid=41e174c9cd

    (Many links to more articles on this subject at the above link)
    Quote Exceptional’ cold front blankets Montana, Wyoming peaks with rare July snow, reads the headline in the Washington Post. We even had the first freezing temperature ever recorded for the month of August in Casper Wyoming. Yet from the federal government we hear that the Earth just keeps getting hotter. According to NOOA July was the planet’s warmest month on record, smashing old marks. That is why it has been snowing in July and August in the northern hemisphere and why many places are experiencing record cold.
    There was no summer this year in Sweden. In Moscow, it was also cold. In the middle of August, temperatures went down beating long-standing records for cold at this time of year by 5-6 degrees. Global warming was the greatest fantasy every created on earth.
    The Washington Times puts it this way, “The U.S. government is at it again, hyping meaningless records in a parameter that does not exist in order to frighten us about something that doesn’t matter. In the final analysis, it is no more meaningful to calculate an average temperature for a whole planet than it is to calculate the average telephone number in the Washington D.C. phone book. Temperature, like viscosity and density, and of course phone numbers, is not something that can be meaningfully averaged. “Global temperature” does not exist.”
    It was the coldest August 17th on record in Holland. Finland is having its coldest summer on record. Jan-July was the coldest on record at Bangor, Maine & sixth coldest at Caribou. July was Northern Ireland’s coldest in 22 years. Scotland saw snow in July. The mercury dipped to 47 degrees at Denver International Airport, setting a record low for Aug. 19.

    This is snow in July in California and if you still believe that your federal government has been telling you the truth about climate change notice that Lubbock, Texas, dipped to a new daily record low of 57 ºF on the 19th of August. Oklahoma City dipped to 50ºF degrees the next day, beating its previous record for Aug. 20 of 56 ºF. This was only one degree shy of the all-time record lowfor the entire month of August set in 1915. More cold is on the way!
    Frosts in the normally tropical highlands in Papua New Guinea and Solomon Islands was the worst frost to hit the province in 40 years has directly affected 300,000 people. Hundreds of villages face months without food from local gardens being destroyed. Meanwhile Artic Sea ice is at highest extent in last five years. Arctic sea ice has INCREASED in volume by a third in recent years despite warnings that it is melting away, according to a new study. Scientists observed 33 per cent more ice than the average in 2013, and 25 per cent more the year after. Yet NOOA is still selling global warming like hotdogs at a baseball game. They have no shame!
    On 22 July a carefully planned, 115-day scientific expedition on the Canadian icebreaker CCGS Amundsen has been put on hold as the vessel was called to help resupply ships navigate heavy ice on the eastern side of Hudson Bay. Worst ice conditions in 20 years due to—you guessed—global warming!
    [IMG]http://http://drsircus.com/wp-content/uploads/2015/08/cold4.jpg
    One does not normally write about coming ice ages in a summer when it has been hotter than hell in some places, and certainly not in the face of a hurricane wind of government backed headlines about this being the warmest year in history. However, like last August, it is snowing in August this year, and we have record-breaking cold in several areas of the world. The mercury dipped to 17.3 degree Celsius in Shanghai on July 6, close to the historic maximum temperature of 15.9 degree Celsius on July 2, 1876. Meaning that was the coldest it has been there in 145 years!
    We have a big problem on our hands and it is going to get much worse. Scientists warn that the Earth is just 15 years away from experiencing a "mini ice age" — something that hasn’t happened in 300 years. Researchers in the U.K. created a new model of the Sun’s solar cycles that allows them to make extremely accurate predictions of changes in solar activity like never before.Solar cycles typically last 11 years and during that time, the north and south magnetic poles flip. It looks a lot like a heartbeat when graphed out. We are currently in Cycle 24.
    The solar scientists say that the latest model shows the Sun’s magnetic waves will become offset in Cycle 25, which peaks in 2022. Then, in Cycle 26, solar activity will fall by 60 per cent during between 2030 and 2040 causing this "mini ice age".
    We have rapid cooling going on at both poles. The world is already beginning to go into a deep freeze and it will get much worse in future years according to real weathermen and real scientists.

    In this must-see 49-minute video presentation – “Is Climate Change Dangerous” Mr. Dilley, CEO and senior research scientist at Global Weather Oscillations, Inc., explains why we need to focus on the real problem of a coming cooling. Dilley, who has forty-two years of professional experience in meteorology and climatology, was with NOAA for twenty of those years.
    The government wrong with its claims of a coming warming, says Dilley, who accuses the federal government of fiddling with global temperature data thereby producing a false picture of what is going on.
    Dr. Mark Sircus, Ac., OMD, DM (P)
    Director International Medical Veritas Association

    Doctor of Oriental and Pastoral Medicine
    Each breath a gift...
    _____________

  20. The Following 8 Users Say Thank You to onawah For This Post:

    Bill Ryan (15th September 2015), Daughter of Time (27th September 2015), Hervé (14th September 2015), meeradas (15th September 2015), moekatz (17th October 2015), Reinhard (15th September 2015), Selkie (27th August 2015), Wind (27th August 2015)

  21. Link to Post #251
    France On Sabbatical
    Join Date
    7th March 2011
    Location
    Brittany
    Posts
    16,763
    Thanks
    60,315
    Thanked 95,902 times in 15,481 posts

    Default Re: The Arctic is melting, the Antarctic is freezing. What does this mean?

    Nobel Laureate Smashes Global Warming Hoax – Video

    September 13, 2015 Robert


    Quote How do you get an average global temperature when there are only eight thermometers in Antarctica?
    This is an extremely important video.

    When the American Physical Society, of which he was a long-time member, announced that the evidence for global warming was “incontrovertible,” Nobel Laureate Ivar Giaever resigned.

    Quote “The only answer to that,” says Giaever, was that 'I resigned.'

    “Global warming has really become a new religion, because you can’t discuss it, ” says Giaever “It’s like the Catholic Church. There are a lot of incontrovertible truths in the Catholic Church, I’m sure.”
    How do you get an average temperature when there are only eight thermometers at the South Pole?


    Look at where the temperatures are measured, says Giaever. The United States is practically covered. But there are only eight thermometers at the South Pole according to NASA.

    Quote “That’s all they have!…. Eight thermometers! …. And it has never been as cold at the South Pole as it is now. There’s more ice than there ever has been.”
    Only eight thermometers in Antarctica, a continent more than twice the size of the entire contiguous United States!

    And we’re supposed to believe the global warming lies?
    "La réalité est un rêve que l'on fait atterrir" San Antonio AKA F. Dard

    Troll-hood motto: Never, ever, however, whatsoever, to anyone, a point concede.

  22. The Following 12 Users Say Thank You to Hervé For This Post:

    araucaria (14th September 2015), avid (16th September 2015), Bill Ryan (15th September 2015), Daughter of Time (27th September 2015), meat suit (14th September 2015), meeradas (15th September 2015), moekatz (17th October 2015), OBwan (15th September 2015), Reinhard (15th September 2015), Selkie (15th September 2015), Sophocles (14th September 2015), Wind (14th September 2015)

  23. Link to Post #252
    United States Avalon Member zen deik's Avatar
    Join Date
    13th April 2013
    Location
    Texas
    Posts
    227
    Thanks
    159
    Thanked 722 times in 196 posts

    Default Re: The Arctic is melting, the Antarctic is freezing. What does this mean?

    It happens from time to time....... Process earth.....
    ONLY THE END OF THE WORLD IS THE END OF THE WORLD AND THIS AIN'T IT

  24. Link to Post #253
    United States On Sabbatical
    Join Date
    30th June 2011
    Location
    The Seat of Corruption
    Age
    44
    Posts
    9,177
    Thanks
    25,610
    Thanked 53,662 times in 8,694 posts

    Default Re: The Arctic is melting, the Antarctic is freezing. What does this mean?

    Quote Posted by Wind (here)
    The data isn't lying, the real one I mean (which we can also witness with our own eyes and ears).


    Solar minimums are historically something to fear... the black plague happened during a long solar minimum.. much worse than "global warming"
    Hard times create strong men, Strong men create good times, Good times create weak men, Weak men create hard times.
    Where are you?

  25. The Following 6 Users Say Thank You to TargeT For This Post:

    Daughter of Time (27th September 2015), Hervé (15th September 2015), meeradas (15th September 2015), Reinhard (15th September 2015), Selkie (15th September 2015), Wind (15th September 2015)

  26. Link to Post #254
    Netherlands Avalon Retired Member
    Join Date
    28th April 2010
    Posts
    1,375
    Thanks
    183
    Thanked 2,809 times in 819 posts

    Default Re: The Arctic is melting, the Antarctic is freezing. What does this mean?

    Love is kind ,Love is slow to anger.
    If it freezing outside my house and not inside my house then I AM cool =).
    This thing about what is happening I can't even see is just a distraction!!
    Free your mind from all this kind of do I have to Worry about everything?
    You should pay more attention to your thoughts and actions then what is outside your line of site.

  27. Link to Post #255
    France On Sabbatical
    Join Date
    7th March 2011
    Location
    Brittany
    Posts
    16,763
    Thanks
    60,315
    Thanked 95,902 times in 15,481 posts

    Default Re: The Arctic is melting, the Antarctic is freezing. What does this mean?

    Mt. Baker glaciers disappearing? A response to the Seattle Times

    by Don J. Easterbrook
    Guest Blogger / 2 days ago September 13, 2015
    The headline of the September 8, 2015 Seattle Times states:

    Quote ‘Disastrous’: Low snow, heat eat away at Northwest glaciers

    “Glaciers across the North Cascades could lose 5 to 10 percent of their volume this year, accelerating decades of steady decline. One scientist estimates the region’s glaciers are smaller than they have been in at least 4,000 years.”

    “The best word for it is disastrous,” said Pelto”
    http://www.seattletimes.com/seattle-...west-glaciers/

    This was a multi-page story with numerous photographs and many predictions that glaciers in the North Cascade Mts. will be gone in 50 years. Having just finished a major analysis of Mt. Baker’s glaciers dating back thousands of years, I thought, what kind of nonsense is this? So I put together some of the data on Mt. Baker glaciers that will soon be published.

    Photos and maps from a large collection dating back to 1909 document exactly what Mt. Baker glaciers have done in the past. What these photos and maps clearly show is the Mt. Baker glaciers reached their maximum extent of the past century in 1915 at the end of the 1880 to 1915 cold period. The glaciers then melted back strongly during the 1915 to 1950 warm period. The climate then turned cool again, and Mt. Baker glaciers advanced strongly for 30 years. In 1977, the climate turned warm again and since about 1980, glaciers have been retreating again. However, photos and maps prove that all Mt. Baker glaciers are more extensive today than they were in 1950. Here are a few examples.

    Roosevelt and Coleman glaciers
    Comparison of the position of the terminus of the Roosevelt glacier on USGS topographic maps of 2014 (blue line) and 1952 (green line) (Fig. 1). Both the Coleman and Roosevelt glaciers are more extensive now than they were in 1952. Figure 2 shows the advance and retreat of the two glaciers measured from vertical air photographs.


    Figure 1. Positions of Coleman and Roosevelt termini in 2014 (blue) and 1952 (green) taken directly from USGS topographic maps.

    [...]

    Comparison of photographs of the Roosevelt glacier in 2015 and 1950 confirm that the glacier is more extensive now than in 1950. In the photos below, note that the terminus of the glacier reaches to the edge of dark cliff (left photo) in 2015, but was well upvalley from it in 1950 (right photo). The X on the photos is a point of reference for comparison.


    Figure 3. Comparision of photographs of the Roosevelt glacier in 2015 (left) and 1947 (right). Note that the glacier is more extensive now than it was in 1947.

    Deming glacier
    Comparison of the position of the terminus of the Deming glacier on USGS topographic maps of 2014 (blue line) and 1952 (green line) (Fig. 4) show that the glacier was more extensive in 2014 than it was in 1952. The right side of the figure shows that rates of advance and retreat of the Deming glacier from 1940 to 1990 (plotted from data in Harper, 1992).


    Figure 4. Comparison of the position of the Deming glacier terminus in 2015 and 1952 taken directly from USGS topographic maps (left).

    Photographs of the Deming glacier 2011-2015 confirm that the glacier is more extensive now than it was in 1950-52. In the photos below the X is a point of reference and the yellow diamond is the terminus. The 2011-2015 terminus is far downvalley (see map) from it’s 1950-52 position.


    Figure 5. Deming glacier, 1950 (left) and 2011 (right).The yellow X is a point of reference and the diamond shape is the position of the terminus in 1950 and 2011. These photos show that the Deming glacier is more extensive now than it was in 1950 and confirm the positions of the terminus shown in Fig. 4.

    Boulder glacier
    Comparison of the position of the terminus of the Boulder glacier on USGS topographic maps of 2015 (blue line) and 1952 (green line) (Fig. 6) show that the glacier is more extensive now than it was in 1952.


    Figure 6. Comparison of the position of the Boulder glacier terminus in 2014 and 1952 taken directly from USGS topographic maps. The glacier is now more than a kilometer downvalley from its 1952 position.


    Figure 7. Photos of the Boulder glacier in 1950 (left) and 2014 (right). The yellow X is a common point of reference and the yellow diamond marks the glacier terminus.

    Photographs of the Boulder glacier 2014 confirm that the glacier is more extensive now than it was in 1950-52. The present is far downvalley (see map) from its 1950-52 position.

    All of Mt. Baker’s other glaciers show the same thing. They are all more extensive now than they were in 1952 and nothing unusual is happening to them—they have been where they are now many times before. Data similar to that shown here for the Coleman, Roosevelt, Deming, and Boulder glaciers is also available for the Easton, Squak, Talum, Park, Rainbow, and Mazama glaciers.

    The Seattle Times states that “Riedel estimates the region’s glaciers are smaller than they have been in at least 4,000 years.” However, the photos and maps of the Sholes glacier, the featured in the Times article, below prove that these claims are totally false˗˗the Sholes glacier has not changed at all in the past 70 years.


    [...]


    Figure 9. The blue line is the margin of the Sholes glacier shown on the USGS 2014 topographic map. The green line is the terminus position shown on the 1952 map. These maps prove that the Shole glacier today is identical to what it was in 1952.

    See full article for additional pictures and graphs.
    "La réalité est un rêve que l'on fait atterrir" San Antonio AKA F. Dard

    Troll-hood motto: Never, ever, however, whatsoever, to anyone, a point concede.

  28. The Following 4 Users Say Thank You to Hervé For This Post:

    Daughter of Time (27th September 2015), meeradas (15th September 2015), moekatz (17th October 2015), Selkie (23rd September 2015)

  29. Link to Post #256
    France On Sabbatical
    Join Date
    7th March 2011
    Location
    Brittany
    Posts
    16,763
    Thanks
    60,315
    Thanked 95,902 times in 15,481 posts

    Default Re: The Arctic is melting, the Antarctic is freezing. What does this mean?

    Scientist who advocates prosecuting climate skeptics ‘paid himself & his wife $1.5 million from govt climate grants for part-time work’

    September 22, 2015 Robert


    From 2012-2014, the leader of the 20-scientist effort to prosecute climate skeptics under RICO reportedly paid himself and his wife $1.5 million from government climate grants for part-time work.

    George Mason University Professor Jagadish Shukla, a Lead Author with the UN IPCC, reportedly made lavish profits off the global warming industry while accusing climate skeptics of deceiving the public.

    Shukla is leader of 20 scientists who are demanding RICO (Racketeer Influenced and Corrupt Organizations Act) charges be used against skeptics for disagreeing with their view on climate change.

    Shukla reportedly moved his government grants through a ‘non-profit’. The group “pays Shukla and wife Anne $500,000 per year for part-time work,” Prof. Roger Pielke Jr. revealed.

    “The $350,000-$400,000 per year paid leader of the RICO20 from his ‘non-profit’ was presumably on top of his $250,000 per year academic salary,” Pielke wrote. “That totals to $750,000 per year to the leader of the RICO20 from public money for climate work and going after skeptics. Good work if you can get it,” Pielke Jr. added.
    See more:

    http://www.climatedepot.com/2015/09/...art-time-work/

    "La réalité est un rêve que l'on fait atterrir" San Antonio AKA F. Dard

    Troll-hood motto: Never, ever, however, whatsoever, to anyone, a point concede.

  30. The Following 5 Users Say Thank You to Hervé For This Post:

    Daughter of Time (27th September 2015), Elainie (23rd September 2015), meat suit (23rd September 2015), Selkie (23rd September 2015), Wind (24th September 2015)

  31. Link to Post #257
    United States Avalon Retired Member
    Join Date
    19th February 2015
    Age
    67
    Posts
    2,202
    Thanks
    7,544
    Thanked 9,601 times in 1,987 posts

    Default Re: The Arctic is melting, the Antarctic is freezing. What does this mean?

    Quote Posted by Hervé (here)
    Mt. Baker glaciers disappearing? A response to the Seattle Times

    by Don J. Easterbrook
    Guest Blogger / 2 days ago September 13, 2015
    The headline of the September 8, 2015 Seattle Times states:

    Quote ‘Disastrous’: Low snow, heat eat away at Northwest glaciers

    “Glaciers across the North Cascades could lose 5 to 10 percent of their volume this year, accelerating decades of steady decline. One scientist estimates the region’s glaciers are smaller than they have been in at least 4,000 years.”

    “The best word for it is disastrous,” said Pelto”
    http://www.seattletimes.com/seattle-...west-glaciers/

    This was a multi-page story with numerous photographs and many predictions that glaciers in the North Cascade Mts. will be gone in 50 years. Having just finished a major analysis of Mt. Baker’s glaciers dating back thousands of years, I thought, what kind of nonsense is this? So I put together some of the data on Mt. Baker glaciers that will soon be published.

    Photos and maps from a large collection dating back to 1909 document exactly what Mt. Baker glaciers have done in the past. What these photos and maps clearly show is the Mt. Baker glaciers reached their maximum extent of the past century in 1915 at the end of the 1880 to 1915 cold period. The glaciers then melted back strongly during the 1915 to 1950 warm period. The climate then turned cool again, and Mt. Baker glaciers advanced strongly for 30 years. In 1977, the climate turned warm again and since about 1980, glaciers have been retreating again. However, photos and maps prove that all Mt. Baker glaciers are more extensive today than they were in 1950. Here are a few examples.

    Roosevelt and Coleman glaciers
    Comparison of the position of the terminus of the Roosevelt glacier on USGS topographic maps of 2014 (blue line) and 1952 (green line) (Fig. 1). Both the Coleman and Roosevelt glaciers are more extensive now than they were in 1952. Figure 2 shows the advance and retreat of the two glaciers measured from vertical air photographs.


    Figure 1. Positions of Coleman and Roosevelt termini in 2014 (blue) and 1952 (green) taken directly from USGS topographic maps.

    [...]

    Comparison of photographs of the Roosevelt glacier in 2015 and 1950 confirm that the glacier is more extensive now than in 1950. In the photos below, note that the terminus of the glacier reaches to the edge of dark cliff (left photo) in 2015, but was well upvalley from it in 1950 (right photo). The X on the photos is a point of reference for comparison.


    Figure 3. Comparision of photographs of the Roosevelt glacier in 2015 (left) and 1947 (right). Note that the glacier is more extensive now than it was in 1947.

    Deming glacier
    Comparison of the position of the terminus of the Deming glacier on USGS topographic maps of 2014 (blue line) and 1952 (green line) (Fig. 4) show that the glacier was more extensive in 2014 than it was in 1952. The right side of the figure shows that rates of advance and retreat of the Deming glacier from 1940 to 1990 (plotted from data in Harper, 1992).


    Figure 4. Comparison of the position of the Deming glacier terminus in 2015 and 1952 taken directly from USGS topographic maps (left).

    Photographs of the Deming glacier 2011-2015 confirm that the glacier is more extensive now than it was in 1950-52. In the photos below the X is a point of reference and the yellow diamond is the terminus. The 2011-2015 terminus is far downvalley (see map) from it’s 1950-52 position.


    Figure 5. Deming glacier, 1950 (left) and 2011 (right).The yellow X is a point of reference and the diamond shape is the position of the terminus in 1950 and 2011. These photos show that the Deming glacier is more extensive now than it was in 1950 and confirm the positions of the terminus shown in Fig. 4.

    Boulder glacier
    Comparison of the position of the terminus of the Boulder glacier on USGS topographic maps of 2015 (blue line) and 1952 (green line) (Fig. 6) show that the glacier is more extensive now than it was in 1952.


    Figure 6. Comparison of the position of the Boulder glacier terminus in 2014 and 1952 taken directly from USGS topographic maps. The glacier is now more than a kilometer downvalley from its 1952 position.


    Figure 7. Photos of the Boulder glacier in 1950 (left) and 2014 (right). The yellow X is a common point of reference and the yellow diamond marks the glacier terminus.

    Photographs of the Boulder glacier 2014 confirm that the glacier is more extensive now than it was in 1950-52. The present is far downvalley (see map) from its 1950-52 position.

    All of Mt. Baker’s other glaciers show the same thing. They are all more extensive now than they were in 1952 and nothing unusual is happening to them—they have been where they are now many times before. Data similar to that shown here for the Coleman, Roosevelt, Deming, and Boulder glaciers is also available for the Easton, Squak, Talum, Park, Rainbow, and Mazama glaciers.

    The Seattle Times states that “Riedel estimates the region’s glaciers are smaller than they have been in at least 4,000 years.” However, the photos and maps of the Sholes glacier, the featured in the Times article, below prove that these claims are totally false˗˗the Sholes glacier has not changed at all in the past 70 years.


    [...]


    Figure 9. The blue line is the margin of the Sholes glacier shown on the USGS 2014 topographic map. The green line is the terminus position shown on the 1952 map. These maps prove that the Shole glacier today is identical to what it was in 1952.

    See full article for additional pictures and graphs.
    It is so easy to lie. It takes no work at all. But it often takes a great deal of work to undo one, and set the record straight.

  32. The Following 3 Users Say Thank You to Selkie For This Post:

    Daughter of Time (27th September 2015), Hervé (23rd September 2015), TargeT (6th November 2015)

  33. Link to Post #258
    France On Sabbatical
    Join Date
    7th March 2011
    Location
    Brittany
    Posts
    16,763
    Thanks
    60,315
    Thanked 95,902 times in 15,481 posts

    Default Re: The Arctic is melting, the Antarctic is freezing. What does this mean?

    Scottish snow
    A blog for the chionophiles of Britain
    @theiaincameron

    #12 - August snow survey 2015

    At long last I have the complete figures in from the August 2015 snow survey that was conducted on the 21st and 22nd of that month. There were a couple of discrepancies up until recently, but I have now ironed these out.

    The total number of patches counted across Scotland was 678 (see table below). This is way more than double the amount for 2014, and hundreds more than any year since the survey was started in 2008.
    Totals since 2008
    2008 - 34
    2009 - 35
    2010 - 34
    2011 - 36
    2012 - 72
    2013 - 81
    2014 - 281
    2015 - 678
    We caution that this total, though very impressive, is likely to be too low. Given the amount of snow that was present all over the hills it’s almost certain that some were missed. However, the patches listed here are confirmed ones, and that’s what we have to go with.

    Thanks are due to a lot of people who assisted in this. Everyone who went out did so at their own expense of time and cost. Without these folk the survey would have been impossible.

    A small percentage of these patches will survive until winter (typically about 8% of the August total survives). Whether 8% of the August total will survive (~54 patches) is debatable. We will have to keep watching.


    A cold summer in Scotland has led to this incredible natural phenomena with remaining ice and snow forming a network of icy tunnels and caves clinging to the edge of mountains
    "La réalité est un rêve que l'on fait atterrir" San Antonio AKA F. Dard

    Troll-hood motto: Never, ever, however, whatsoever, to anyone, a point concede.

  34. The Following 3 Users Say Thank You to Hervé For This Post:

    meat suit (6th November 2015), TargeT (6th November 2015), Wind (6th November 2015)

  35. Link to Post #259
    Scotland Avalon Member greybeard's Avatar
    Join Date
    17th March 2010
    Location
    Inverness-----Scotland
    Language
    English
    Age
    78
    Posts
    13,356
    Thanks
    32,618
    Thanked 68,863 times in 11,839 posts

    Default Re: The Arctic is melting, the Antarctic is freezing. What does this mean?

    It has been a cool summer here in Scotland--however the last few weeks have actually been relatively mild--highs of 15c.
    No ice on the car windows in the morning and that is rare for this time of year.
    Last winter was long but not much snow--seemed about 6 month of an aver age below 10c but not much ice on the road, so not a severe winter.
    The long range fore cast was snow for late October, that did not happen but we are "promised" a exceptionally severe winter.

    Chris
    Be kind to all life, including your own, no matter what!!

  36. The Following 2 Users Say Thank You to greybeard For This Post:

    Hervé (6th November 2015), Wind (6th November 2015)

  37. Link to Post #260
    Finland Avalon Member Wind's Avatar
    Join Date
    25th September 2011
    Location
    A dream called Life
    Age
    33
    Posts
    7,888
    Thanks
    88,326
    Thanked 48,968 times in 7,673 posts

    Default Re: The Arctic is melting, the Antarctic is freezing. What does this mean?

    Last edited by Wind; 14th November 2015 at 18:19.
    "When you've seen beyond yourself, then you may find, peace of mind is waiting there." ~ George Harrison

  38. The Following 3 Users Say Thank You to Wind For This Post:

    Bill Ryan (21st January 2016), Fairy Friend (14th November 2015), Hervé (21st January 2016)

+ Reply to Thread
Page 13 of 24 FirstFirst 1 3 13 23 24 LastLast

Posting Permissions

  • You may not post new threads
  • You may not post replies
  • You may not post attachments
  • You may not edit your posts